Spring Boot is rapidly becoming one of the most popular frameworks for building web applications and microservices because it supports declarative programming, can be configured extensively, and has a large community of users ready to help.
In particular, Spring Boot is generally used in enterprises because it’s considered one of the most reliable technologies on the market. Specifically, it offers several ways to track events and metrics and monitor what’s happening through the Spring Boot Actuator.
In this tutorial, you’ll learn how to build a Java web application with Spring Boot that collects metrics via the Micrometer library and automatically sends them to an instance of InfluxDB, the ideal database for storing this type of data.
Creating a Spring Boot App to Collect Application Metrics
As previously stated, in this article, you’ll learn how to create a Java Spring Boot web application to collect metrics and send them to InfluxDB. Before you begin this tutorial, you’ll need the following:
- A valid InfluxDB instance or access to InfluxDB Cloud. (If you don’t have this, you can learn how to set it up in the next section.)
- The Java JDK version 8 or newer installed on your system.
- An integrated development environment (IDE) of your choosing.
These are prerequisites for building a Spring Boot web application to manage a publication. This application will expose APIs that allow publication editors to retrieve, create, update, and delete draft posts received from their authors. In addition to providing access to these features, the demo application will use Micrometer to store some useful log metrics in InfluxDB.
If you want to test the demo application you’re going to learn how to build, clone the GitHub repository supporting this tutorial with the following command:
git clone https://github.com/Tonel/influxdb-spring-boot-demo
Then run the DemoApplication main class by following this guide in the Spring Boot official documentation.
Now it’s time to build the demo application.
Set Up InfluxDB
If you don’t have access to an InfluxDB database instance, you can set up an InfluxDB account in order to enter InfluxDB Cloud. This gives you access to an InfluxDB database on the cloud for free:
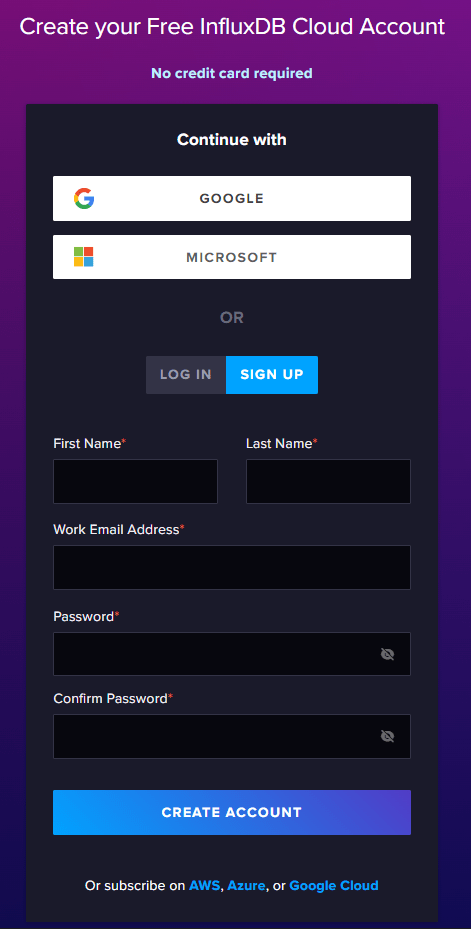
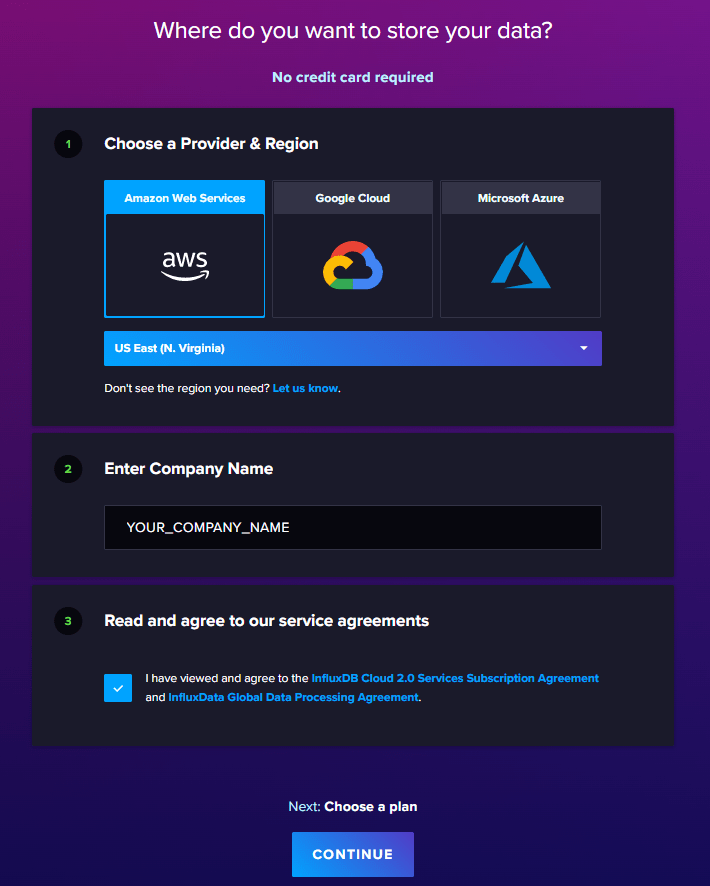
Fill out the sign-up form and continue following the prompts. Select your cloud provider and region, enter your company name, accept the service agreements, and select Continue:
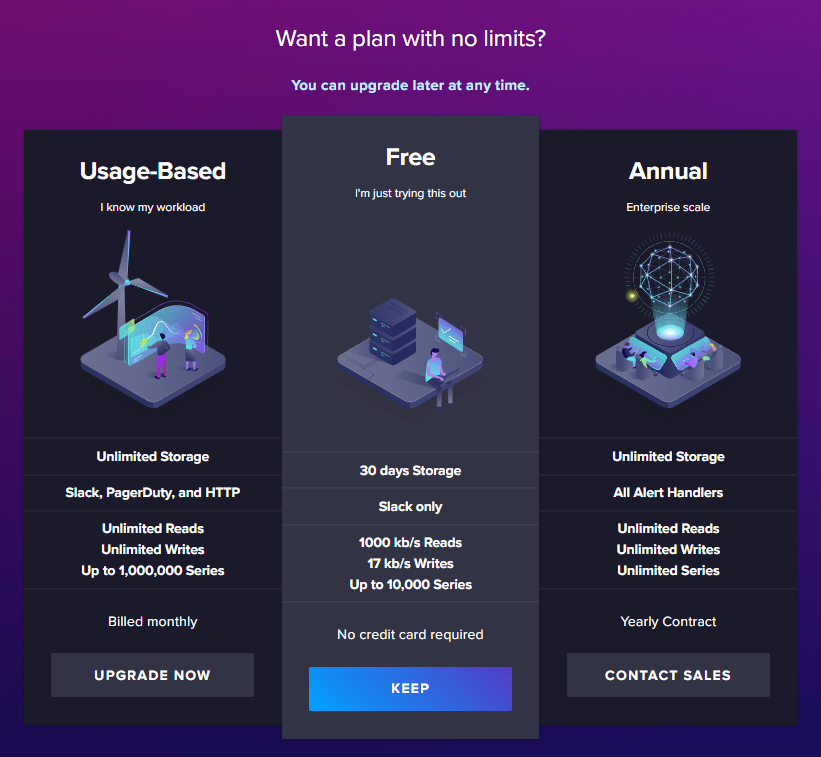
At this point, you can choose from three different plans. The free plan is sufficient to build the demo application:
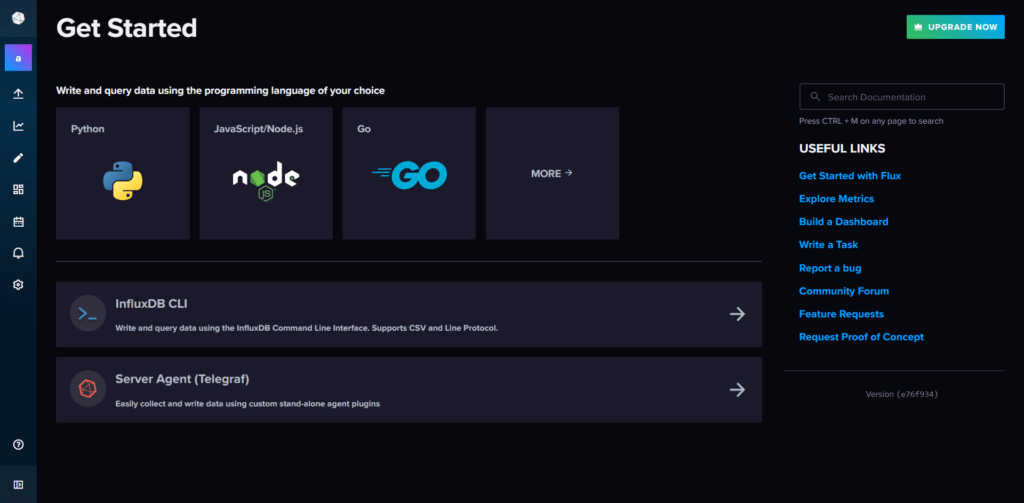
Once completed, you’ll have access to the InfluxDB platform:
In the left bar, hover over the Load Data event and select API Tokens:
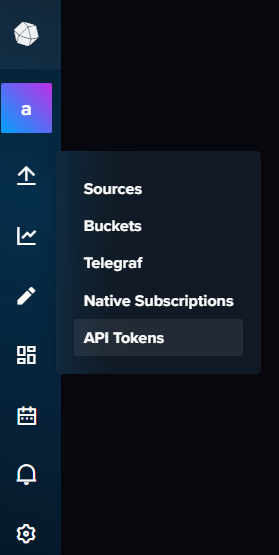
Once selected, you should see the following:
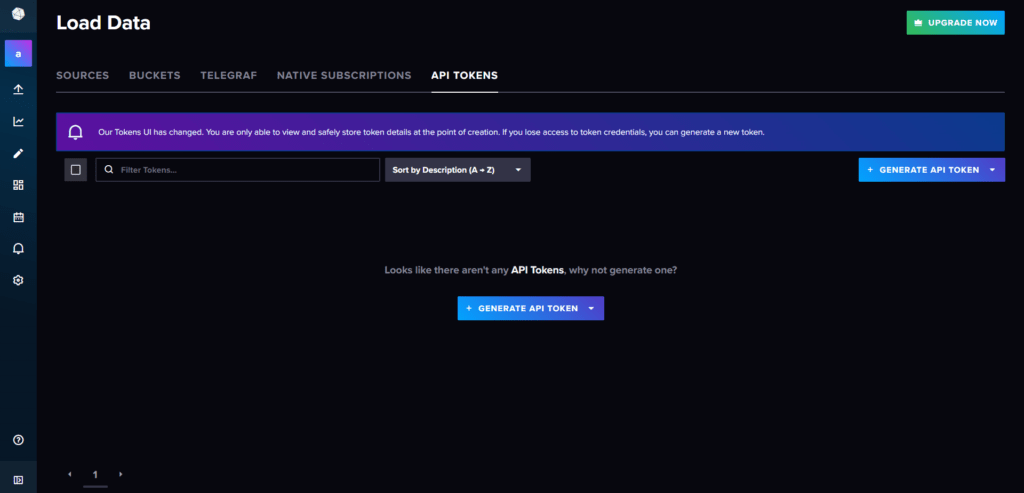
Click + GENERATE API TOKEN > All Access API Token and click Save. An alert containing your API Token should appear:
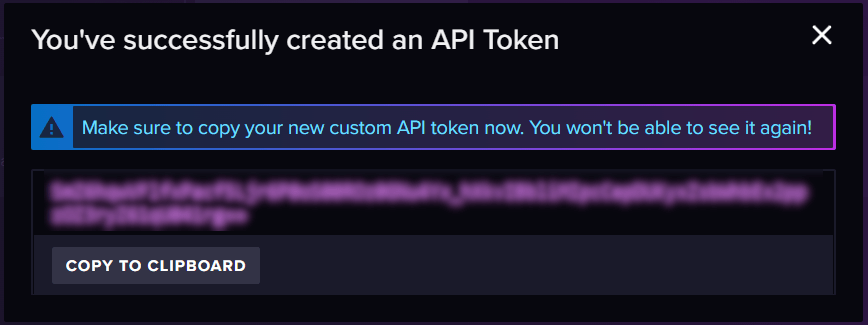
Select COPY TO CLIPBOARD and store your API Token in a safe place, as you’ll need it later on.
Set Up an InfluxDB Bucket
Now it’s time to set up your first InfluxDB bucket. In the bar on the left, hover over the Load Data element again, but this time, select Buckets:
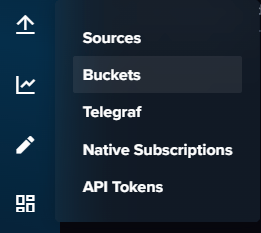
Now you should see the bucket management panel:
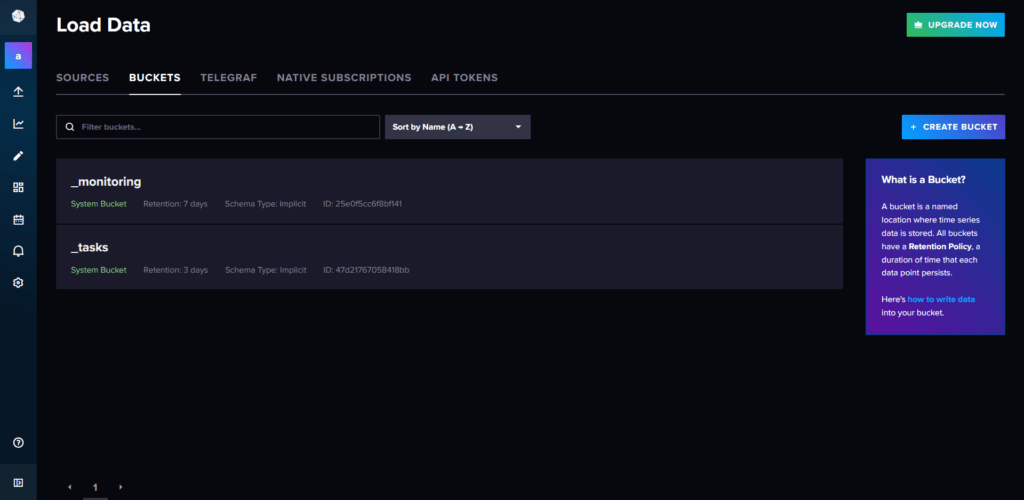
Click on + CREATE BUCKET in the upper-right-hand corner and name your new bucket “posts”:
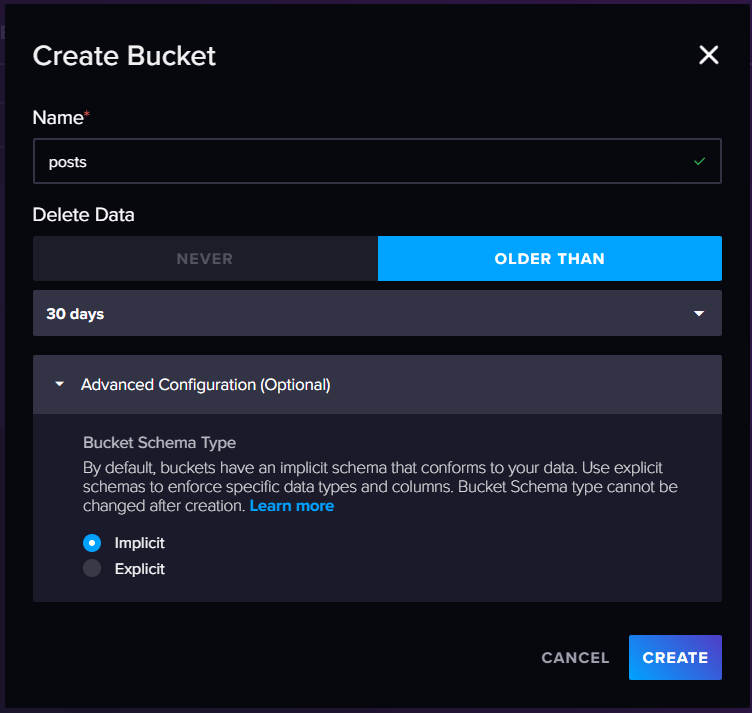
Select CREATE, and now you’re ready to start using InfluxDB!
Initialize a Spring Boot Application
After setting up an InfluxDB bucket, it’s time to set up a blank Spring Boot application. Visit spring initializr and fill out the following form:
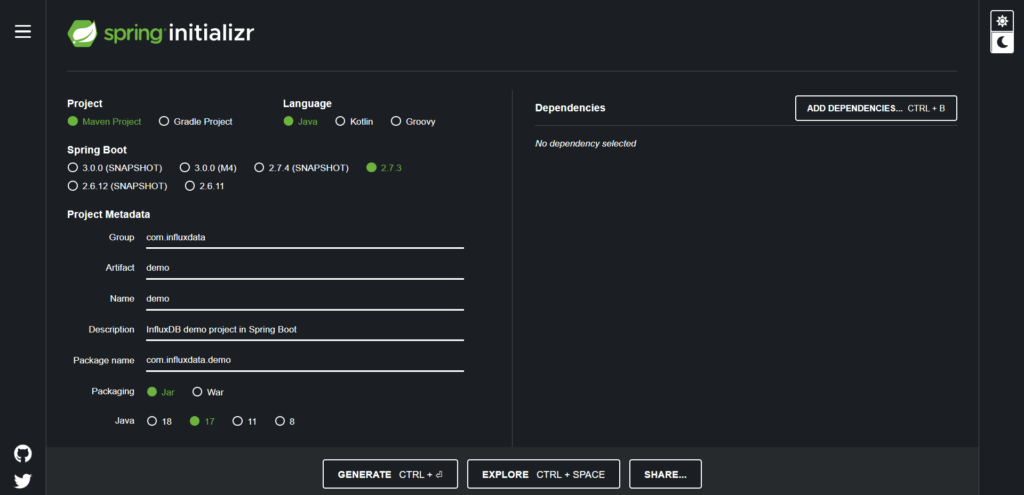
Select GENERATE, and your browser should automatically download a demo.zip file. Extract it, and you’ll find your Spring Boot blank Maven project. Open the project with your favorite IDE, and you can get started adding some libraries.
Add the Required Dependencies
To make your Java Spring Boot demo application collect metrics and send them to InfluxDB, you need to download some additional libraries:
-
org.springframework.boot:spring-boot-starter-web: provides you with everything you need to build microservices in Spring Boot. -
org.springframework.boot:spring-boot-starter-actuator: gives you access to production-ready features to monitor your app, gather metrics, and understand traffic. More information about Spring Boot Actuator is available in Spring Boot’s official docs. -
org.springframework.boot:spring-boot-starter-data-jpa: allows you to store and retrieve data in a relational database. -
com.h2database:h2: gives you access to an in-memory H2 database instance.
Once you’ve downloaded these libraries, you need to add them to the project’s dependencies.
To install these libraries, add the following dependencies to your pom.xml file:
<dependency>
	<groupId>org.springframework.boot</groupId>
	<artifactId>spring-boot-starter-web</artifactId>
</dependency>
<dependency>
	<groupId>org.springframework.boot</groupId>
	<artifactId>spring-boot-starter-actuator</artifactId>
</dependency>
<dependency>
	<groupId>org.springframework.boot</groupId>
	<artifactId>spring-boot-starter-data-jpa</artifactId>
</dependency>
<dependency>
	<groupId>com.h2database</groupId>
	<artifactId>h2</artifactId>
	<scope>runtime</scope>
</dependency>
Please note: The H2 database was chosen for simplicity. You can replace it with any other database technology and use the Spring Boot JPA to connect. The demo application will still work.
Keep in mind that the goal of your demo application is to collect metrics and export them to InfluxDB. To achieve this, you need to use the Micrometer tool.
Install Micrometer
Micrometer is a dimensional-first metrics-collection tool that helps you time, count, and gauge your code. The Spring Boot Actuator supports Micrometer and provides dependency management and auto-configuration.
To install Micrometer, add the following dependencies to your pom.xml file:
<dependency>
	<groupId>io.micrometer</groupId>
	<artifactId>micrometer-core</artifactId>
	<version>1.9.3</version>
</dependency>
<dependency>
	<groupId>io.micrometer</groupId>
	<artifactId>micrometer-registry-influx</artifactId>
	<version>1.9.3</version>
</dependency>
io.micrometer:micrometer-core is the core Micrometer dependency, and io.micrometer:micrometer-registry-influx enables Micrometer to automatically export data to InfluxDB.
Once Micrometer is installed, you can start building your Spring Boot application to store metrics in InfluxDB.
Build the Demo Application
Before building your Spring Book application, you need to initialize the project structure. This will contain the following packages:
-
controllers: contains all Spring Boot REST controllers. -
entities: contains all the JPA entity mappings. -
dtos: contains all the data transfer object (DTO) data classes. -
repositories: contains all JPA repositories.
To begin building the demo application, configure your H2 database instance. Add the following lines to the application.properties Spring Boot file:
spring.datasource.url=jdbc:h2:mem:testdb
spring.datasource.driverClassName=org.h2.Driver
spring.jpa.database-platform=org.hibernate.dialect.H2Dialect
spring.jpa.hibernate.ddl-auto=create-drop
spring.jpa.hibernate.ddl-auto=create-drop causes the database to be recreated each time the Spring Boot application is launched. Considering that H2 is an in-memory database, this is exactly what you want.
Now, enter the entities folder and initialize the Post.java file with the following code:
package com.influxdata.demo.entities;

import javax.persistence.*;
import java.util.Objects;

@Entity
@Table(name = "posts")
public class Post {
  @Id
  @GeneratedValue(strategy = GenerationType.IDENTITY)
  private Long id;

  private String url;

  private String authorEmail;

  // getters, setters, equals, and hashCode omitted for brevity
}
This @Entity class contains the post requests information and maps the posts H2 table that will be created automatically on startup. Keep in mind that you need to implement the omitted getters, setters, equals, and hashCode functions to make the class work. You can take a look at the full code on this GitHub site.
Now, define a JPA repository for Post. Under the repositories folder, initialize the PostRepository.java JPA repository class as follows:
package com.influxdata.demo.repositories;

import com.influxdata.demo.entities.Post;
import org.springframework.data.jpa.repository.JpaRepository;
import org.springframework.stereotype.Repository;

@Repository
public interface PostRepository extends JpaRepository<Post, Long> {
}
If you’re not familiar with JPA repositories, you can learn more in the official Spring reference documentation. Specifically, you need the PostRepository class to perform CRUD operations on Post.
Now it’s time to configure Micrometer to automatically write data to your InfluxDB instance. You can achieve this by adding the following lines to your application.properties file:
management.metrics.export.influx.bucket=${INFLUXDB_BUCKET}
management.metrics.export.influx.org=${INFLUXDB_ORG}
management.metrics.export.influx.token=${INFLUXDB_TOKEN}
management.metrics.export.influx.uri=${INFLUXDB_URI}
If you don’t know how to define these four env files, take a look at the following description:
-
INFLUXDB_BUCKET: is the name of the InfluxDB bucket (in this example, its “posts”). -
INFLUXDB_ORG: is your InfluxDBorgvalue. On InfluxDB Cloud, you can retrieve it at/load-data/client-libraries/java. -
INFLUXDB_TOKEN: is the API token you created earlier. -
INFLUXDB_URI: is the URI to the InfluxDB instance (here, it’shttps://us-east-1-1.aws.cloud2.influxdata.com).
Next, you need to use a Micrometer to log data. Following is an example of how you can use Micrometer:
Counter counter = Metrics.counter(
  // metric name
  "request.posts",
  // tags
  "postId", // key
  1, // value
  "status", // key
  "draft-received" // value
);

// updating the metric in memory
// and automatically writing it to InfluxDB
counter.increment();
In detail, the snippet earlier will record the metric couples <"postId", "1"> and <"status", "draft-received"> in Micrometer.
As you can see, a Micrometer element consists of a name and a list of tags. You can initialize a Micrometer element with Metrics.counter(). To do so, separate each word of the metric’s name with a period. This will help ensure the portability of metric names across different monitoring systems.
Please note that
Metrics.counter()tagsvariables follow akey, valueapproach. Whencounter.increment()is executed, the metrics data will be automatically transferred to InfluxDB behind the scenes.
You can configure Spring Boot to expose Micrometer metrics via the Actuator web endpoints with the following application.properties configurations:
management.endpoint.metrics.enabled=true
management.endpoints.web.exposure.include=*
management.endpoint.beans.enabled=true
If you’re not familiar with the Spring Boot Actuator web endpoints, you can learn more in this official documentation.
Then you can access the request.posts Actuator endpoint with the following URL:
http://localhost:8080/actuator/metrics/request.postsThis will return the following:
{
  "name": "request.posts",
  "description": null,
  "baseUnit": null,
  "measurements": [
    {
      "statistic": "COUNT",
      "value": 0
    }
  ],
  "availableTags": [
    {
      "tag": "postId",
      "values": [
        "1"
      ]
    },
    {
      "tag": "status",
      "values": [
        "draft-received"
      ]
    }
  ]
}
Now, you need to initialize a PostRequest DTO class. Enter the dtos package and create a PostRequest.java file like this:
package com.influxdata.demo.dtos;

import com.fasterxml.jackson.annotation.JsonProperty;

public class PostRequest {
  @JsonProperty("url")
  private String url;

  @JsonProperty("authorEmail")
  private String authorEmail;

  public PostRequest() {}

  public String getUrl() {
    return url;
  }

  public void setUrl(String url) {
    this.url = url;
  }

  public String getAuthorEmail() {
    return authorEmail;
  }

  public void setAuthorEmail(String authorEmail) {
    this.authorEmail = authorEmail;
  }
}
This class will be used by the following PostController to map the data received from the users in the POST and PUT requests.
Now, you’re ready to define a simple PostController class exposing basic CRUD API logging data to InfluxDB with Micrometer. Enter the controllers folder and create a PostController.java file as follows:
package com.influxdata.demo.controllers;

import com.influxdata.demo.dtos.PostRequest;
import com.influxdata.demo.entities.Post;
import com.influxdata.demo.repositories.PostRepository;
import io.micrometer.core.instrument.Counter;
import io.micrometer.core.instrument.Metrics;
import org.springframework.beans.factory.annotation.Autowired;
import org.springframework.http.HttpStatus;
import org.springframework.http.ResponseEntity;
import org.springframework.web.bind.annotation.*;
import java.util.List;

@RestController
@RequestMapping("api/v1/posts")
public class PostController {

  private final PostRepository postRepository;

  PostController(@Autowired PostRepository postRepository) {
    this.postRepository = postRepository;
  }

  @GetMapping()
  public ResponseEntity <List<Post>> getAll() {
    return new ResponseEntity<> (
      postRepository.findAll(),
      HttpStatus.CREATED
    );
  }

  @PostMapping()
  public ResponseEntity <Void> create(
    @RequestBody PostRequest postRequest
  ) {
    // creation logic
    Post postToCreate = new Post();
    postToCreate.setUrl(postRequest.getUrl());
    postToCreate.setAuthorEmail(postRequest.getAuthorEmail());
    Post post = postRepository.save(postToCreate);

    // logging the initial post request status with Micrometer
    Counter counter = Metrics.counter(
      "request.posts",
      "postId",
      post.getId().toString(),
      "status",
      "draft-received"
    );

    counter.increment();

    return new ResponseEntity<>(HttpStatus.CREATED);
  }

  @PutMapping("{id}")
  public ResponseEntity < Void > update(
    @PathVariable(value = "id") Long id,
    @RequestBody PostRequest postRequest
  ) {
    // update logic
    Post postToUpdate = postRepository.findById(id).get();
    postToUpdate.setUrl(postRequest.getUrl());
    postToUpdate.setAuthorEmail(postRequest.getAuthorEmail());
    postRepository.save(postToUpdate);

    // logging the new post request status with Micrometer
    Counter counter = Metrics.counter(
      "request.posts",
      "postId",
      id.toString(),
      "status",
      "updated"
    );

    counter.increment();

    return new ResponseEntity<>(HttpStatus.OK);
  }

  @DeleteMapping("{id}")
  public ResponseEntity<Void> delete(
    @PathVariable(value = "id") Long id
  ) {
    // delete logic
    postRepository.deleteById(id);

    // logging the new post request status with Micrometer
    Counter counter = Metrics.counter(
      "request.posts",
      "postId",
      id.toString(),
      "status",
      "deleted"
    );

    counter.increment();

    return new ResponseEntity <> (HttpStatus.NO_CONTENT);
  }
}
Launch your Spring Boot application and start creating, updating, and deleting posts. Then visit your InfluxDB Data Explorer page, select the posts bucket, and review your metrics:
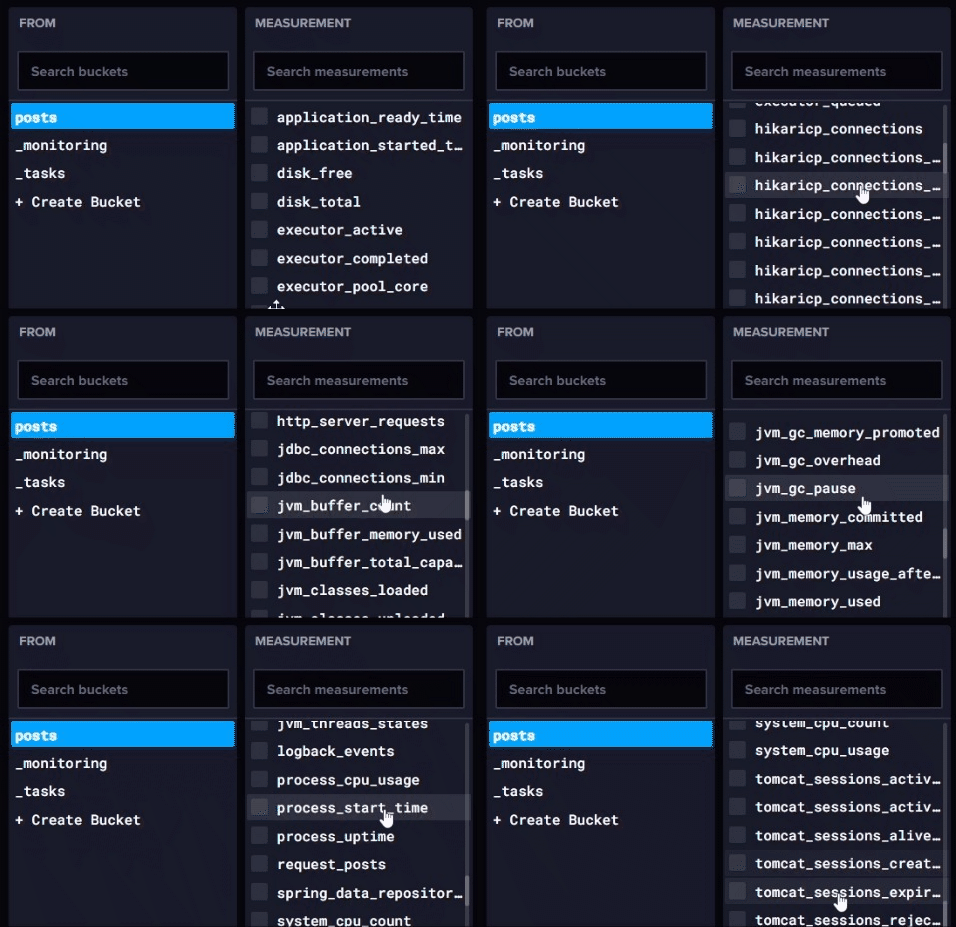
Please note that the Spring Boot Actuator library automatically defines a list of useful application metrics in Micrometer, which sends them accordingly to InfluxDB. You can learn how to enable or disable these metrics in Spring Boot’s official docs.
To view your custom log metrics, activate the Simple Table view, select request_posts at the bottom of the screen, and turn on the View Raw Data option through the slider. And you should be able to see your custom log metrics:
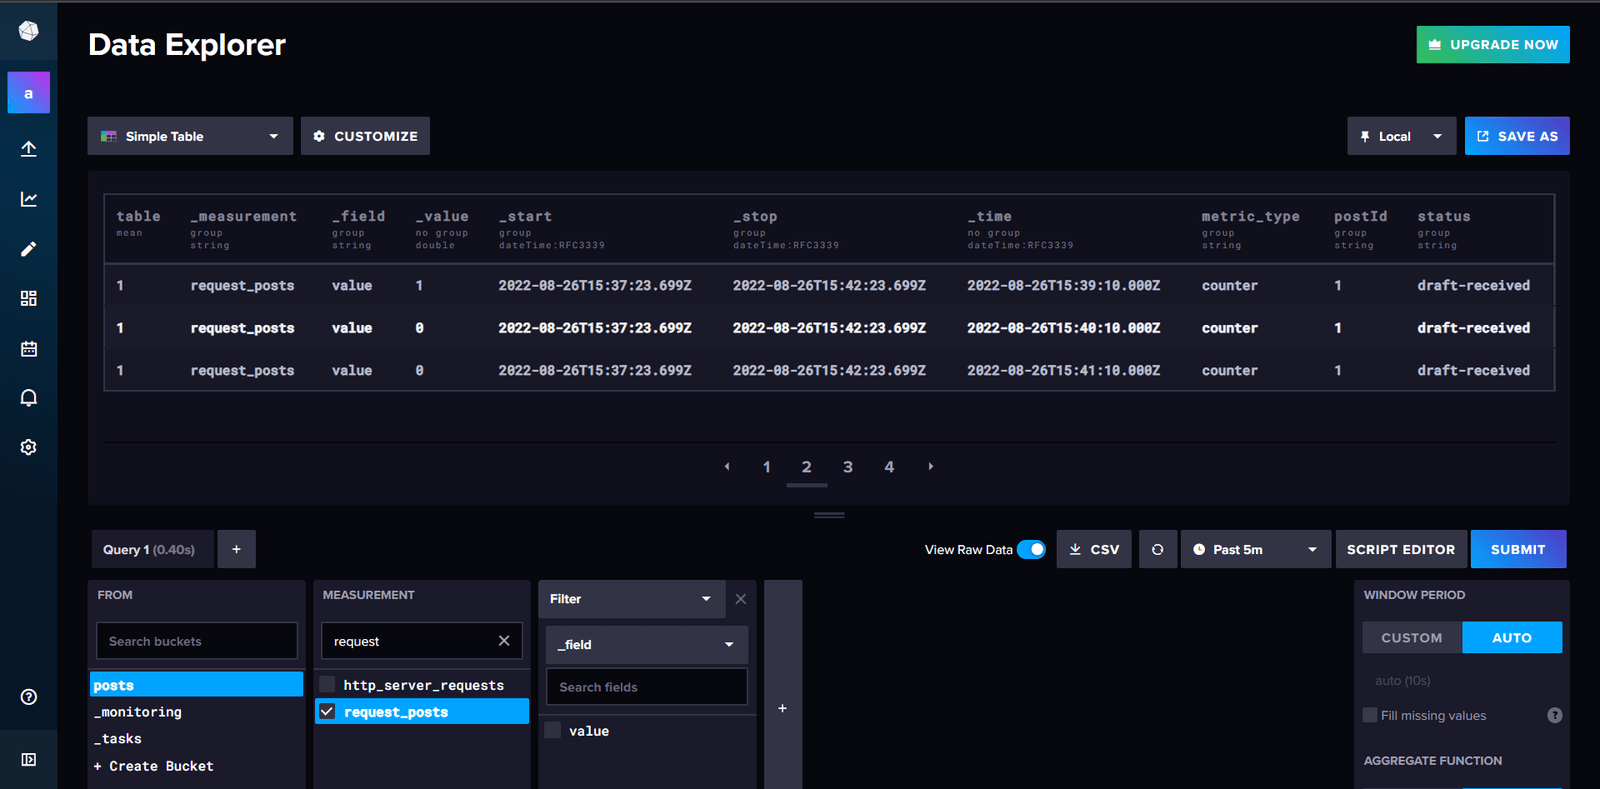
Now, you’ve officially collected application metrics with Micrometer and stored them on InfluxDB in Spring Boot.
Conclusion
In this article, you learned how to build a Spring Boot Java application that can collect metrics and store them automatically in InfluxDB. With a dimensional metrics collection tool like Micrometer, you can configure your Spring Boot application to collect different metrics and send them to your preferred database technology.